NDVI Information
Net Difference Vegetation Index (NDVI) was developed in the 1970s by NASA and Texas A&M University. NDVI is based on how plants both reflect infrared light and absorb visible light in the photosynthesis process.
ForeSight makes 8,000 NDVI measurements/acre or 1.2 million data points for a 160 acre field. To deal with this large amount of data, results are presented in graphic forms:
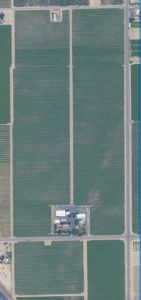
- Full Color Image. A visual reference for the data.
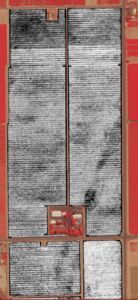
- NDVI Grayscale Image. NDVI image with black representing the weakest growth and white the strongest
- Colorized NDVI Zones. This is the most useful image. It highlights areas in the field with weak growth. NDVI data is segmented into color zones with green being healthiest, followed by yellow, orange, and red being weakest growth.
Often the pattern of weak growth indicates the type of problem. Wind borne diseases spread in a fan shape; irrigation problems occur along the irrigation system; misapplication problems tend to be geometric, etc. ForeSight provides the specific location of a problem for the agronomist to use in determining treatment.
Problem Detection Imagery
Full Color
NDVI Grayscale
For information, contact:
Kevin Spry
1-805-748-7153 Kevin.Spry@GeoG2.Com
ForeSight Services
Problems Detected
Crop Sample Imagery
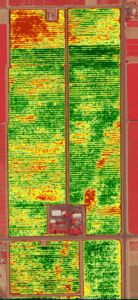
Colorized NDVI Zones